
Every project plan rests on a pile of small guesses: this ticket is two hours, that one is a day. People are notoriously bad at those guesses. Kahneman and Tversky named it the planning fallacy back in 1979: we anchor on the best case and forget how long similar work took last time.
The obvious fix is to ask an AI. But a large language model has never seen your team, your clients or your codebase, so whatever number it gives you is a well-written guess. The information that actually predicts how long your next task will take is already sitting in your timesheets: thousands of finished tasks, each with the hours someone really spent on it.
So we built Monton's effort estimate the other way round. Instead of a model that generates an answer, it retrieves the most similar work your organization has already done and lets that history vote. Under the hood it is a classic non-parametric method, k-nearest neighbours (kNN) regression, running over modern text embeddings.
Key points:
- It learns from your data only. Estimates come from your own finished tasks and logged hours, never from other companies.
- It has no training phase. kNN is a lazy learner: every task you finish becomes a new data point instantly.
- It is explainable. Every estimate comes with the similar tasks that produced it, so you can see why.
- It is about as good as the team, and covers what the team skips. At Bewise it matched human accuracy on the tasks people estimated, and gave a number for the 60% of tasks nobody estimated.
1. The problem, formally
Each finished task in an organization has a text description and a target value , the total hours logged against it:
where is the set of time allocations on task and the duration of each one. That gives us a labelled history
and the task is a supervised regression problem: given the text of a new task , predict .
Two properties of this data shape everything that follows. First, is small by machine learning standards: a few hundred to a few thousand tasks per organization, too few to fine-tune a model per customer. Second, is heavy-tailed: most tasks take one to four hours, but a few take forty. Both push us towards a method that needs no training and is robust to outliers.
2. From text to vectors: embeddings
A kNN needs a notion of distance, and distances need vectors. We map each task to a point in with an embedding function .
The text we embed is a fixed template built from the task's own fields:
query: <task name> (<project> / <phase> / <type>) . <description>
Ticket prefixes such as TASK-625: are stripped (they carry no effort signal), HTML from the editor is reduced to plain text, and the description is capped at 1,200 characters.
The encoder is multilingual-e5-small, a 12-layer transformer trained with contrastive learning so that texts with similar meaning land close together, in any of roughly 100 languages. That matters for teams who write tickets in Spanish, English and Catalan in the same week. The encoder produces a contextual vector for each of the tokens; we mean-pool them and L2-normalise the result:
After normalisation every task lives on the unit hypersphere . We run the model as an int8-quantised ONNX graph inside our own servers: tens of milliseconds per task once warm, and the text of your tasks never goes to an external AI API.
Each vector is stored next to the task in Postgres with pgvector, together with a SHA-256 hash of the exact text and model, so a task is only re-embedded when its text actually changes.
3. Similarity: cosine on the unit sphere
The similarity between the new task and a finished task is the cosine similarity:
The last step is why we normalise: on unit vectors, cosine similarity is a plain dot product, and it relates directly to Euclidean distance through . Ranking by highest similarity and ranking by shortest distance are the same thing.
4. The neighbourhood
The candidate pool is every task in the organization that is finished, not archived, embedded and has logged hours greater than zero. The current task is excluded, so a task can never "estimate itself". From that pool we keep the most similar:
We deliberately run an exact scan instead of an approximate nearest-neighbour (ANN) index such as HNSW. The pool is filtered per organization, and with filtered ANN search a small organization can end up with too few candidates surviving the filter, quietly degrading recall. Per-organization data is small enough that exact search stays fast, and it is always exactly right.
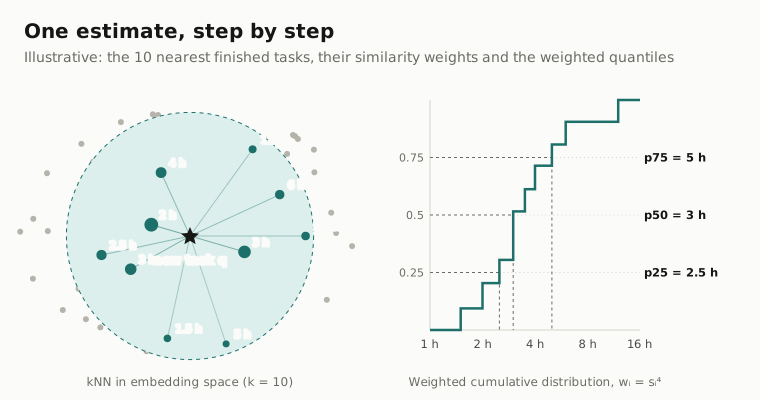
5. Weighting: closer neighbours vote louder
A plain kNN gives every neighbour the same vote. We weight each neighbour by a power of its similarity:
The exponent exists because of a known property of e5 embeddings: similarities are compressed into a narrow band, roughly 0.75 to 1. On Bewise's data, the closest match for a task has a median similarity of 0.937; a quarter of tasks have no match above 0.923, and one in ten none above 0.913. Raw similarities in that band barely differ, so raising them to the fourth power stretches the contrast: a neighbour at 0.96 gets weight 0.849, one at 0.92 gets 0.716, so the ratio between them grows from 1.04 to 1.19. It is a mild sharpening, a soft version of a temperature in a softmax, that favours the closest matches without letting one of them decide alone.
6. The estimate: weighted quantiles, not a mean
The naive kNN regressor is the weighted mean, . With heavy-tailed hours that is fragile: one forty-hour task among nine two-hour tasks drags the mean to almost six hours. So we use weighted quantiles instead.
Sort the neighbours by hours and build the weighted empirical cumulative distribution function:
The -quantile is the smallest observed value at which the cumulative weight reaches :
Monton returns three of them. The weighted median is the point estimate; and form an interquartile interval that tells you how much similar work has varied.
The median isn't an arbitrary choice. It is the value that minimises the weighted absolute error, and more generally each quantile minimises the pinball loss used in quantile regression:
With , : the estimate is optimal under absolute error, which treats a three-hour miss as a three-hour miss instead of squaring it, and ignores the occasional forty-hour monster.
7. Knowing when not to trust it
Two guards keep the estimate honest:
- Cold start. Below finished tasks with logged hours, there is no estimate at all. The task dialog shows a progress counter instead ("12/20").
- Low confidence. If even the closest neighbour is far away, , the estimate is flagged as low confidence. The threshold sits at roughly the bottom quartile of closest-match similarity on real data: in those cases your organization simply hasn't done anything like this before, and the number should be read as a rough reference.
What you see in Monton
In the task dialog, under Effort, Monton shows the AI estimate as the median and the p25–p75 range, lists the similar finished tasks it was based on with their logged hours and similarity, and offers a one-click Use X h button. The same estimator is available to AI assistants through Monton's MCP server, so you can ask Claude to estimate a whole list of tasks while drafting a proposal.
8. Success case: Bewise
Bewise is a software development company that runs its projects, timesheets and staffing on Monton, so it was the natural first dataset. When we ran the analysis it had 5,090 finished tasks with 31,178 logged hours.
What the team actually does
Before estimating anything, the same embeddings answer a simpler question: what kind of work fills the hours? Monton's new Task insights report clusters the task vectors into themes. One technical detail matters here. Because the project name is part of the embedded text, raw clusters group tasks by project rather than by activity. We fix that by project-centring each vector, subtracting a shrunk project mean:
where is the task's project and its number of tasks. The shrinkage factor keeps small projects from being centred on a noisy mean. We then run k-means, minimising the within-cluster sum of squares
a language model proposes a taxonomy of single-activity categories and names each cluster, and the map is laid out with classical multidimensional scaling (MDS) of the cluster centroids, so themes that sit close on the map are semantically close in the embedding space.
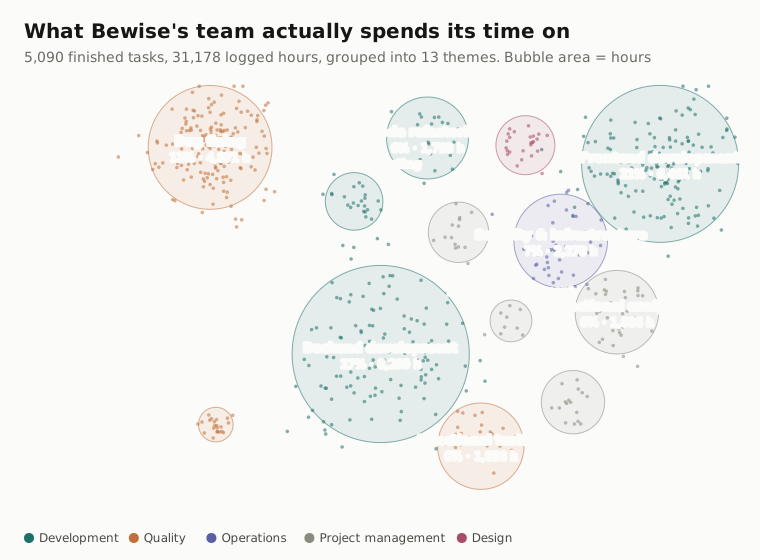
Development dominates, as you'd expect, but the map also shows that bug fixing alone is 13% of all hours, more than functional analysis, documentation and meetings combined.
Why a range and not a single number
The same report shows how much effort varies inside each theme. The boxes below are the interquartile ranges of logged hours per task:
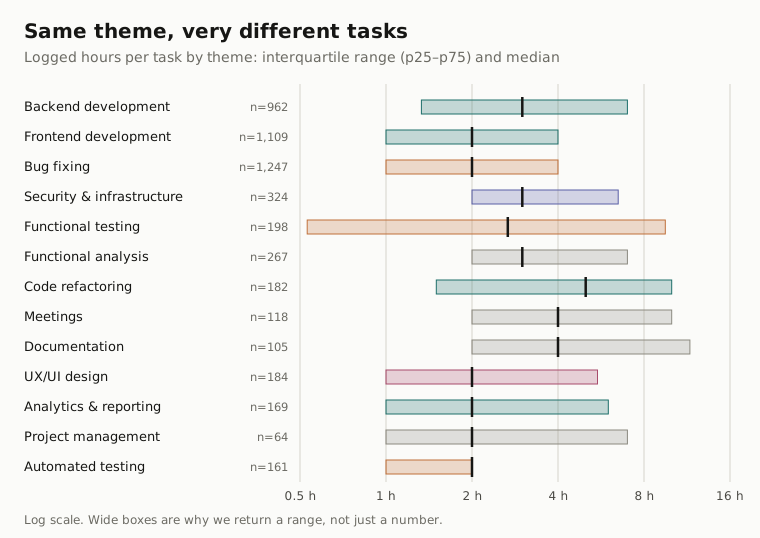
Functional testing has a median of 2.7 hours, but a quarter of those tasks take more than 9.5. Any method that returns a single number for "a testing task" will be wrong most of the time. kNN works one level below the theme, on the ten most similar individual tasks, and still reports the spread so you can see when the history is noisy.
Accuracy against the team
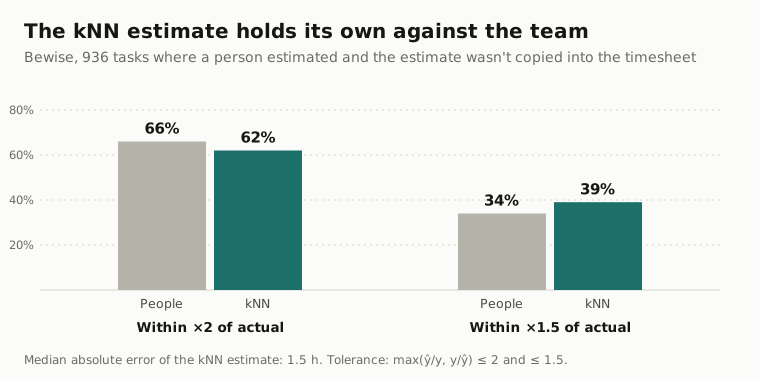
Evaluating against human estimates has a trap. Of the tasks that had a human estimate, 1,077 logged exactly the estimated hours: the estimate was copied into the timesheet, so it would look perfect. We exclude those and compare on the 936 tasks where a person estimated and the logged hours differ. Each task is estimated leave-one-out, from all other finished tasks, exactly as the live system does.
We measure a hit when the estimate is within a factor of reality, which treats over- and under-estimation symmetrically:
| Bewise, finished tasks | Tasks | People within ×2 | kNN within ×2 |
|---|---|---|---|
| Genuinely estimated by a person | 936 | 66% | 62% |
| … of which tasks | 877 | 66% | 62% |
| … of which bugs | 53 | 62% | 62% |
| Estimate copied into the timesheet | 1,077 | excluded | excluded |
| Never estimated by anyone | 3,077 | no estimate | estimated |
The numbers read in three ways:
- Same league as the team. At the usual ×2 tolerance the kNN is four points behind the people who know the work, with no human time spent.
- Tighter when it hits. At ×1.5 it beats the team, 39% against 34%. The median absolute error is 1.5 hours.
- It covers the blind spot. 3,077 of the 5,090 tasks, 60%, never had an estimate at all. For capacity planning those are the tasks that hurt, and they now get a data-backed number.
Low accuracy on a single task isn't always a failure, either. The report lists tasks that took at least three times what their nearest neighbours took (524 at Bewise), or a third or less (473). Those outliers are where scope crept, a ticket was used as a bucket, or a problem turned out to be harder than it looked: exactly the tasks a retrospective should look at.
9. Why kNN, and not a bigger model?
Fine-tuning a neural regressor per customer, or prompting a large language model for a number, were both on the table. kNN won on properties that matter more than a few points of benchmark accuracy:
- It builds on your organization's data, and only on it. The embedding model is general-purpose: it only knows that "fix login redirect" and "corregir redirección del login" mean similar things. Everything that decides the number, your stack, your clients, your team's speed and how you split work into tasks, comes from your own history. Estimates for an agency that ships WordPress sites and for one that builds banking back ends will be different, as they should be.
- No training pipeline, no drift. There are no weights to fit per customer and no retraining schedule. The moment a task is marked finished with hours logged, it is part of the model. Nearest-neighbour regression is a well-studied consistent estimator (Stone, 1977): the more history it has, the closer the neighbours it finds, so estimates tend to improve with use on their own.
- Explainability by construction. A neural network's estimate is a function of millions of parameters. A kNN estimate is a function of ten tasks you can click on. If the suggestion looks wrong, the neighbour list usually shows why in a few seconds.
- Privacy and isolation. The search runs inside the database under the caller's permissions, with row-level security scoping every query to one organization. No other company's tasks can ever be a neighbour of yours, and the embedding model runs on our own infrastructure.
- Calibrated uncertainty for free. Because the output is a distribution rather than a point, the p25–p75 range comes at no extra cost and widens when your history is inconsistent.
- A virtuous loop. Estimates are only as good as the hours logged. Teams that track time carefully get sharper estimates, which makes planning better, which makes the timesheet worth keeping up.
10. Limitations
The method inherits the quirks of its data. If tasks are titled "Development" with no description, there is little text to match on. If hours are logged against the wrong task, the neighbours carry the error. Brand-new kinds of work have no neighbours, which is precisely what the low-confidence flag tells you. And kNN estimates how long similar work took, not how long it should take: if a team is consistently slow at something, the estimate will faithfully reproduce that.
The takeaway
Good estimation doesn't need a model that knows everything. It needs one that knows your work. By combining a compact multilingual encoder with one of the oldest ideas in machine learning, nearest neighbours, Monton turns the hours you already log into estimates that are explainable, private and improving every time a task is finished. In Bewise's case that meant estimates on par with the team's own, and a number for the 60% of tasks that never had one.
References: D. Kahneman and A. Tversky, "Intuitive prediction: biases and corrective procedures" (1979). T. Cover and P. Hart, "Nearest neighbor pattern classification", IEEE Transactions on Information Theory (1967). C. J. Stone, "Consistent nonparametric regression", The Annals of Statistics (1977). L. Wang et al., "Multilingual E5 text embeddings: a technical report" (2024). R. Koenker and G. Bassett, "Regression quantiles", Econometrica (1978).
Frequently asked questions
- How does Monton's AI estimate the effort of a task?
- It turns the task's name, project, phase, type and description into a 384-dimensional vector with a multilingual embedding model, finds the 10 most similar finished tasks in your organization, and returns the similarity-weighted median of the hours logged on them, along with the 25th–75th percentile range.
- Is the model trained on other companies' data?
- No. The embedding model is a general-purpose language model that only converts text into vectors. The estimate itself comes exclusively from your organization's finished tasks and logged hours, and row-level security keeps every organization's data separate.
- How many tasks do I need before estimates appear?
- At least 20 finished tasks with logged hours. Below that, Monton shows a progress counter instead of a number. Estimates get more reliable as more tasks are finished, with no retraining step.
- How accurate is it?
- At Bewise, on 936 tasks with a genuine human estimate, the kNN estimate landed within a factor of two of the real hours 62% of the time, against 66% for the team, and it was closer than the team at the tighter ×1.5 tolerance (39% vs 34%). It also gives an estimate for the 60% of tasks nobody estimated.
- Does my task text get sent to an external AI provider?
- No. The embedding model runs inside Monton's own servers, so the text of your tasks is not sent to a third-party AI API to compute estimates.